Good morning,
Thanks for all of your support as I cover this pandemic in my own unique way. Many of you posted comments and questions last week, and I hope that happens again at the bottom of today’s newsletter.
On to the show.
—Edward
Charting Death
Charting COVID-related deaths is a morbid but necessary process for learning more about the virus. At first glance, the fatality rate of COVID-19 seems to vary dramatically from one place to the next. By taking Worldometer’s tracking data (for any country with more than 40 deaths) and simply dividing deaths by the total number of confirmed cases, you find an astonishingly wide range of fatality rates:
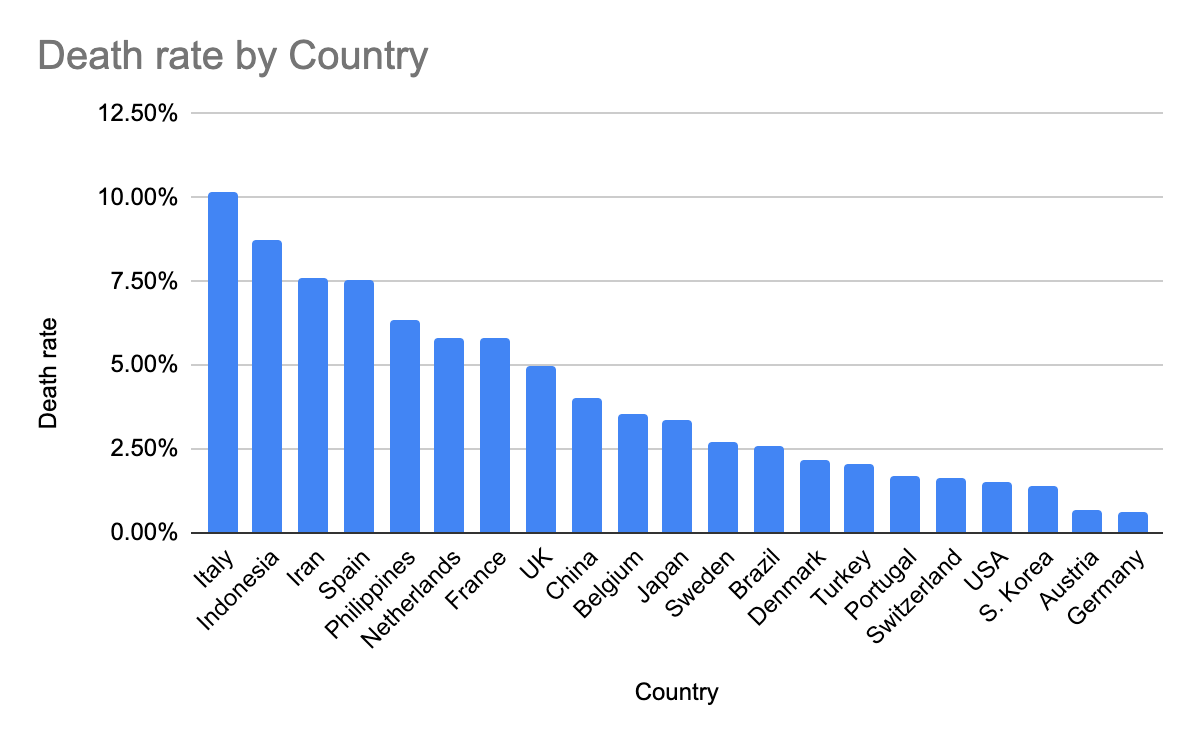
In Italy, over 10% of patients diagnosed with COVID-19 have died. On the other end of the spectrum is Germany, where only 0.61% of patients with positive cases have died. Two western European nations with fatality rates that differ by more than an order of magnitude. How? And why?
There are three common explanations for the significant variation in fatality rates by country:
Death rates spike when high numbers of patients overwhelm hospitals, resulting in a shortage of ventilators — a problem that impacted Italy and Iran (and may hinder treatment options in New York and Detroit).
There are cohort issues (a concept I explained in “Coronavirus and Cohorts”). If (1) infections are rapidly spreading, and (2) there is a delay (of several weeks) between infection and death, then simply dividing CURRENT deaths by CURRENT infections will radically understate the EVENTUAL death rate.
There are testing issues. If you only test patients in serious condition, you will OVERSTATE the death rate. Anyone with mild or asymptomatic cases won’t die (by definition), but they also won’t get tested — so they don’t get counted at all. If people with mild (or no) symptoms were accurately tested and counted, they would bring down the average death rate.
In addition to those three explanations, there are several other factors that may be responsible for the extreme variation of fatality rates by country.
Cause of death: COVID-19 is particularly dangerous for people with pre-existing medical conditions — especially heart disease, diabetes, and chronic respiratory diseases (like asthma). Suppose a person with heart disease, diabetes, and/or asthma contracts COVID and subsequently dies; should their cause of death be recorded as COVID or as their pre-existing condition?
This STAT article from late February outlines the ways that China revised their definition of a “COVID-related death”:
On Feb. 12, the national health committee announced that it was changing the way cases were counted in Hubei province. People with symptoms of the disease and with evidence of pneumonia on a CT scan but who had not been tested for presence of the virus — in other words, people who had a clinical diagnosis — would be added to the list of cases.
The criteria for determining cause of death varies depending on the country and city — and perhaps even according to the individual hospital and individual medical practitioner. The lack of universal guidelines has clouded our ability to compare fatality rates from one country to another.
Dosage: “Viral load” refers to the number of viral particles carried by an infected individual. Quite simply, a person with sustained, direct exposure to a virus (like living with an infected person) will receive a higher viral load than a person with brief, indirect exposure (like touching a door knob at a store).
In previous pandemics, increased viral loads correlated with higher fatality rates. This 2005 academic study analyzed the case of an apartment building where almost every resident contracted SARS — the death rate varied dramatically based on physical distance between the apartment for each resident and the one for the index patient. A 1986 study from West Africa concluded that patients exposed to measles by a family member died at much higher rates than patients infected with measles via external sources.
According to preliminary research about COVID-19, there IS a correlation between high viral load and more severe symptoms. In practical terms, this information suggests that people infected by prolonged contact with an infected individual are FAR more likely to experience serious consequences (including death) than someone who was infected from incidental contact like touching a grocery cart.
Let’s return to questions about why some countries are facing greater numbers of total cases and deaths. In Italy, multigenerational living arrangements are common. Could their close-knit family structure — with regular opportunities for family members to infect each other with high doses — explain their high hospitalization and death rates?
Culture: On Twitter, Trevor Sutcliffe posted his curious analysis of death rates in Switzerland. He found that “COVID-19 has been twice as likely to kill patients in French-speaking cantons of Switzerland than in German-speaking, and more than twice as likely to kill patients in Italian speaking cantons than in French ones.” Are cultural differences — especially in terms of physical contact — responsible for the extreme variation? Italians hugging each other, French kissing cheeks, and Germans politely nodding their heads from across the room?
Here are two less-plausible explanations for the variation of fatality rates by country.
Strains: Another theory suggests the possibility of multiple strains of the virus. Perhaps a powerful strain swept across northern Italy, while a weaker strain hit Japan? At the moment, no credible virologists have supported this theory.
Genetic Differences: Are Italians simply more susceptible to coronavirus? This theory seems absurd, unless there is some gene shared by Italians, Spaniards, Iranians, New Yorkers, and Chinese, with a different “less susceptible” gene traceable to Germans, Japanese, South Koreans, and Nigerians.
Japan and Iceland — The Island Anomalies

With “only” 1866 total cases and 54 deaths, Japan appears to have avoided a substantial COVID outbreak.
How?
So far, few experts can explain Japan’s situation. Japan was one of the first non-Chinese countries infected, and — in contrast to other countries — they did not (1) impose widespread lockdowns, (2) employ extensive testing, or (3) use high-tech surveillance to reduce community transmission. Moreover, Japan has the world’s highest percentage of citizens over the age of 65, the demographic of people who are most susceptible to COVID-related hospitalization and death. Although Japanese culture includes elements of “social distance,” urban population density is so high that subways hire “professional pushers” to squeeze people onto the trains.
On many levels, the explanation for Japan’s relative success is still a mystery. At this point, our collective knowledge about COVID-19 is limited; there are more unanswered questions than comprehensive answers.
Some countries are trying to pick away at specific questions. Let’s take a look at Iceland’s latest efforts.
Countries are struggling to identify the total number of positive cases within their borders. Without extensive testing, government officials cannot track mild or asymptomatic cases. Instead, many governments only record serious cases, which are (by definition) more likely to result in a fatality. With (1) inadequately low numbers of tests, and (2) disproportionate testing of serious cases, a country could radically overestimate their fatality rate (with no idea about the margin of overestimation).
The clear solution? Test “everyone” — or as many people as possible — so that you have a clearer picture of the total number of positive cases. Iceland has pursued this strategy.
From a March 25 article in Al Arabiya:
As of Sunday night, the country’s health authorities and the biotechnology firm deCode Genetics have tested more than 10,300 people. That might not sound like a large number, compared to the around 350,000 Americans who have been tested for coronavirus according to the COVID Tracking Project, but it is a far higher percentage of tests per capita — a ratio Icelandic authorities have claimed is the highest in the world.
But it is not just the numbers of people being tested that is unusual about Iceland’s approach.
Unlike other countries, where people are only tested if they exhibit symptoms of coronavirus or have come into contact with known spreaders, the country is testing thousands of people from the general population who don’t exhibit any symptoms of the virus whatsoever — helping to reveal information about the nature of the pathogen and its symptoms.
While Iceland has only 218 confirmed cases among its tiny population, its testing program has produced crucial data about the coronavirus — that half of those who were tested positive have no coronavirus symptoms.
This information suggests that widespread testing is an effective strategy. Iceland tested 10,300 “random” people, identifying 218 (~2.1%) with the virus. Because half of the positive cases showed no symptoms, those people might have — without the random testing — continued to unknowingly infect other people.
In other words, extensive testing slows community transmission.
But just as we solve one problem, we expose another: false positives with low penetration rate.
The Problem with Personalization
Back in 2012, the New York Times published an article that exposed how retailers were using massive databases of customer data to predict consumer behavior.
The article shares the story of a father who was furious that Target had mailed coupons for baby clothes and cribs to his 16-year old daughter — implying that she was pregnant. Two days later, the father apologized — his daughter WAS pregnant, something that Target’s algorithm identified before he did. The anecdote quickly made the rounds, with coverage in Forbes, Time, Fox News, and The Daily Mail.
Marketers still rely on the “Target figured out a teen pregnancy” story to highlight the power of personalization; the tale is particularly popular with vendors who sell personalization services and employees who want to do “cool stuff.” People treat big data like a magic wand that can reveal secrets about consumer activity, helping companies make lots of money by “better serving customer needs.”
But there’s one big problem with the Target story: the author’s claims were just not true. In the original NYT article, the retailer refuted the details of the anecdote:
When I sent Target a complete summary of my reporting, the reply was more terse: “Almost all of your statements contain inaccurate information and publishing them would be misleading to the public. We do not intend to address each statement point by point.”
My perspective: the story is false. How do I know? Math.
For the purposes of a hypothetical explanation, let’s assume two facts:
2% of women in a specific age group are pregnant at any given time.
Target developed an algorithm that could identify pregnant women with 90% accuracy.
Here’s how things would play out in a group of 1000 women:
20 women (2% of 1000) are pregnant. Target correctly identifies 18 of them as pregnant (20 women x 90% accuracy).
980 women (98% of 1000) are not pregnant. Target incorrectly identifies 98 of them as pregnant (980 women x 10% error rate).
In this hypothetical example, Target’s algorithm identifies 116 women (18 + 98) as pregnant — but only 18 of those women are actually pregnant. Thus, Target’s “90% accurate algorithm” is only correct 15% of the time! (18 pregnant / 116 identified as pregnant).
Without question, 15% is still a much higher identification of pregnancy than complete chance (2% in this example). But suppose a company developed a personalization tool that was only accurate 15% of the time. Would they really mail a flyer saying “Congratulations on your new baby!”? Of course not.
Despite what many vendors claim, personalization is not the Holy Grail of marketing.
Personalization CAN help remove small groups from an overall sample; this tactic can marginally improve targeting. In this example, the pool of women that Target’s algorithm identified as NOT pregnant had a lower-than-0.5% chance of being pregnant. Perhaps you want to remove the ads for prenatal vitamins from the flyers you send that group of women? Sure. But remember that personalization cannot accurately identify small segments within a larger sample.
The Problem with Iceland
There are two main methods to test people for infection with coronavirus:
Nasopharyngeal (nose) and oropharyngeal (throat) swabs detect the RNA of the virus.
A serology (blood) test measures the antibody responses to the virus in a person’s blood serum.
Serology tests are not only more accurate for identifying positive cases, but they can also determine if a person was previously infected.
Recall that Iceland tested 10,300 “random” people, identifying 218 (~2.1%) with the virus. For that round of testing, Iceland used nose swabs.
So how accurate are Iceland’s tests?
We don’t know. Typical nose or throat swab tests for influenza can identify positive cases with 50–70% accuracy; tests show a false positive in approximately 5–10% of cases.
Using the above information, we can apply the same process I used to debunk the Target teen pregnancy story.
For the purposes of this hypothetical illustration, let’s assume a few facts:
Iceland tested 10,000 people (not far off the 10,300 they actually tested).
1% of citizens are currently infected (this is a totally hypothetical number!).
The COVID-19 test is 70% accurate (using the top end of the influenza test).
The COVID-19 test presents false positives in 5% of cases (using the bottom end of the influenza test).
Here’s how things might have unfolded for the 10,000 people:
100 people (1% of 10,000) are infected. The test correctly identifies 70 people (100 people x 70% accuracy).
9900 (99% of 1000) are not infected. The test incorrectly identifies 495 people (9900 people x 5% error rate) with a false positive.
In this hypothetical example, Iceland’s test identified 565 people (70 + 496) as infected — but only 70 of those people (12.3%) actually have the virus.
Obviously, the numbers from this hypothetical example don’t align with Iceland’s official reports; the country only found 218 confirmed cases. How can we explain the discrepancy? There are three likely reasons: (1) their base rate must be lower, (2) their sample was not really random, or (3) their test’s accuracy is far higher than the 70%/5% we cited for flu tests.
Still, no wonder Iceland discovered that half of the people they identified had no symptoms: when you test a random sample where the base rate is very low, false positives will overpower your results (unless your test is uncannily accurate).
I know of only one example using “random” serology tests. In San Miguel County, Colorado, 645 first responders were given blood tests. Serology tests provide highly accurate results; every test came back negative (two had a “mild signal change,” which leads to recommended 12-day isolation and additional testing as a precaution). Due to the limited parameters of this test, we cannot learn much useful data about the true asymptomatic rate of COVID-19 infection. If anyone does come across large-scale serology testing results, please do share them in the comments.
Final Thoughts

Do not assume that if you contract the coronavirus, then you have a 50% chance of experiencing no symptoms at all. At this stage in our knowledge, I do not think we can tell the difference between (1) someone who is asymptomatic, and (2) someone who does not have the infection at all, but registered as a false positive on a swab test. If I am right, then COVID has not spread as far as the worst projections. BUT, this would also mean that the “diagnosed” death rate may not be as overstated as some optimists hope.
Problems with testing doesn’t mean that extensive testing is not helpful. In this short post, Paul Romer (2018 Nobel Prize winner, and former Chief Economist of the World Bank) runs simulations on COVID strategies. He considered the impact of running extensive tests and then placing all the people who test positive into quarantine (allowing the rest of the economy to function normally). Romer analyzed the limits of a test’s inaccuracy before the strategy would not work. His conclusion? Even if we took action based on a test that was only 20% accurate, we could still dramatically reduce the devastation caused by COVID-19.
Dosage might matter. This concept should increase your motivation to protect yourself and take precautions. If you wear gloves and a mask to the grocery store, you might still end up contracting the coronavirus, but not AS BIG a viral load as you might receive without the protection. A lower viral load may allow your body to better fight off the virus, saving you a possible trip to the hospital (or worse). Rumors abound that the CDC will reverse its previous suggestions about masks. An forthcoming message might recommend that people wear masks whenever leaving home (see last week’s post for reasons why Americans hold such little trust for official departments).
Were you thinking of taking a break from coronavirus stuff and initiating a personalization project for your business? Just don’t.
Keep it simple and stay safe,
Edward
If you are enjoying Marketing BS, the best thing you can do is share it with friends and recommend they subscribe. The next best thing you can do is comment on this piece or click the heart (which makes this article more visible for other readers).
Edward Nevraumont is a Senior Advisor with Warburg Pincus. The former CMO of General Assembly and A Place for Mom, Edward previously worked at Expedia and McKinsey & Company. For more information, including details about his latest book, check out Marketing BS.


Great piece of intelligent analytical argumentation, just like previous editions.